


This page describes how to implement a standing ovation model (Miller & Page 2004) in a spreadsheet.
Let's start with a simple grid model of an auditorium with 10 rows and 10 seats in each row. We'll also define a variable called "performance" which will be the quality of the performance.

Next let's give each member of the audience a "perception" of the performance. We'll let these be normally distributed around the "actual" quality of the performance using an Excel formula
| =NORM.INV(RAND(),performance,0.1) |
We can think of the deviation from the mean as the "noise" inherent in people's evaluation of a performance.
We drag the formula across all the members of the audience:
Next we create a parallel grid that will contain the audience members' ovation threshold. At first we can set these all to a set value, say, 0.5.
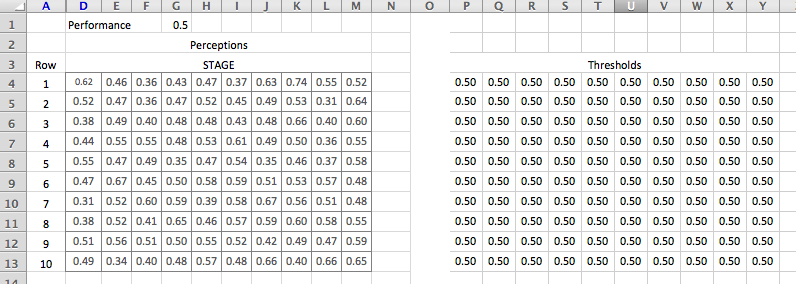
The table on the right shows each audience member's assessment of the performance and the table on the right shows each member's threshold for standing up (all set to 0.5 for now). Below we visualize this by coloring seats where an audience member stands green.To create the time zero result each cell (audience member) just compares her assessment of the performance with her threshold. Here is the formula for the left-most seat in row 1:
| =IF(D4>P4,1,0) |

Our model will allow two different modes of paying attention to the people around you. The first has us taking note only of those who are immediately next to us or immediately in front (including one seat diagonally to the right and left). Following Page and Miller we call this a 5-neighborhood. The other mode is that an audience member can pay attention to a "cone" of people in front of her. These are illustrated below:

Our first version of the model will use 5-neighborhoods. We draw a new seat grid and compute what each audience member "sees" as far as how many people are standing in her 5 neighborhood. The formula looks like this (if an audience member is standing the cell contains a 1, sitting, 0)
| =IF((SUM(E18:G19)-F19)/5>=R$6,1,0) |
which we read as "if the sum of my neighbors (everyone in the 2x3 grid around me minus myself) divided by the number of neighbors is greater than my threshold then I will stand up (that is, set my value to 1), otherwise I sit (value = 0).

| T0 |
T1 |
T2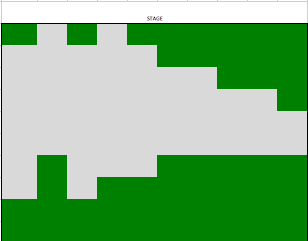 |
T3 |
T4 |
T5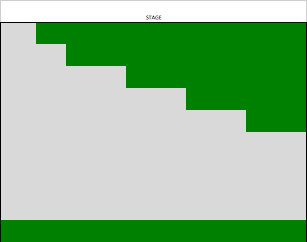 |
T6 |
T7 |
T8 |
T9 |
T10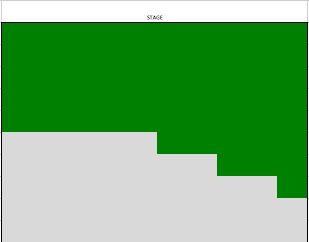 |
T11 |
